
This article contains affiliate links. Our evaluation approach does not change depending on whether you sign up. Prices, promotions, plan specifications, data centers and backup conditions can change, so check each provider's official pages before signing a contract.
There is no single fastest hosting service for every website. Speed depends not only on the provider but also on the plan, distance to visitors, WordPress theme, plugins, images, external tags, caching and test time. A practical way to choose is to shortlist two or three providers by use case, then test the same replica site under the same conditions.
Shortlist by use case and test for yourself instead of relying on the old TTFB ranking
The old article listed values from 30 ms to 440 ms, but common test locations, target URLs, run counts, plans, cache states and raw logs were not retained. The figures remain as historical records, separate from any current ranking.
| Article conclusion | Shortlist two or three providers by use case and repeatedly test the same replica site under the same conditions, instead of relying on a fastest-provider ranking |
|---|---|
| Key metrics | TTFB, LCP, INP and CLS. Do not mix lab values with real-user data. |
| Number of runs | At least five runs per condition; in practice, about ten at different times of day |
| Values to use | The median and slower results, not the minimum. Check the 75th percentile for real usage. |
| Old values for 18 providers | Published as historical records, but excluded from current rankings because common conditions and raw logs are unavailable |
| Final decision | Include administration, recovery, migration, email, support and renewal costs as well as display speed |
The 2026 conclusion: do not choose the fastest company first
The first step in a speed comparison is not to rank 18 providers. Narrow the field by visitor region, site type, budget and operating team, then test only those candidates with the same site. The following are shortlists by use case to begin retesting, not speed rankings.
Xserver
A starting point for comparing speed, usability, migration and operations for a WordPress site serving Japan. Features include HTTP/2, FastCGI, OPcache, browser caching and XPageSpeed.
- Measure TTFB and LCP with the same theme and plugins as production
- Test with XPageSpeed enabled and disabled to check its benefits and any problems
- Measure the WordPress administration area as well as public pages
Official speed features do not guarantee results for your own site.
wpX Speed
A candidate if a dedicated WordPress environment, NVMe, per-account CPU and memory allocation, and autoscaling matter to you. For a publication with traffic spikes, test normal and loaded conditions separately.
- Compare W1 and higher plans under the same load conditions
- Set autoscaling conditions and a budget cap in advance
- Check pages excluded from caching and logged-in use as well
Dedicated optimization alone does not make every WordPress site the fastest.
Kinsta
A candidate for high-traffic or important WordPress sites when backups, staging, migration, and support matter as well as speed. Tokyo and Osaka are available locations in Japan.
- Choose a location near visitors and record whether a CDN is used
- Actually check daily backups and the restoration procedure
- Weigh price differences against operating effort and recovery time
Comparison is more useful when it includes restoration after an incident and staff time, not just minimum TTFB.
Hostinger
A candidate if you want to reduce initial costs, run a site for an overseas audience, or use hPanel. LiteSpeed, NVMe, CDN, and backup frequency vary by plan, so do not decide on the introductory monthly price alone.
- Compare the full initial term separately from the monthly renewal price
- Check the distance between the selected data center and main visitors
- Check which plans offer weekly or daily backups
Promotional prices change. Check the total, renewal price, and tax on the order screen.
ConoHa WING
This service assists with WordPress installation and migration. New sign-ups are temporarily suspended, so check that registration has resumed before considering it. Existing users should measure speed under their own site's conditions.
- Match entry-level plans or comparable price tiers
- Match cache conditions after copying the site
- Review regular prices separately from long-term discounts and renewal terms
As of November 9, 2026, new sign-ups are temporarily suspended for emergency maintenance. A resumption date has not been announced.
mixhost
A candidate for comparing WordPress with LiteSpeed Cache or cloud hosting for a Japanese audience. Measure first loads and the administration interface separately, not only cached responses.
- Document LiteSpeed Cache settings for every candidate
- Check backup exclusions and retention by plan
- Record cache HIT and MISS on separate rows
Separate plugin-driven acceleration from the origin server's own response.
Xserver Business is another candidate for business sites.Compare it with standard Xserver and managed services on migration, support, restoration, and staff usability as well as speed.
What determines hosting speed?
A site that feels slow can be delayed in several places. TTFB is the time from the start of a request until the first byte arrives; redirects, DNS, connection setup, TLS, CDN, and origin processing can all affect it. After HTML arrives, images, CSS, JavaScript, fonts, and advertising tags also affect LCP and INP.
A rough goal for many sites; not itself a Core Web Vital.
How quickly the main content appears, affected by both server response and image rendering.
Responsiveness to interaction. Lighthouse has no real user interactions, so use TBT as a supplementary lab metric.
Visual layout shifts, mainly affected by factors other than the server, such as image dimensions, ad slots, and fonts.
Core Web Vitals are assessed at the 75th percentile.Rather than using an average or best score, separate mobile and desktop and check whether at least 75% of visits meet the good threshold.
URLs and redirects
Chains involving HTTP to HTTPS, www, language, or trailing slashes consume time before HTML processing. A lab test of only the final URL can miss this.
DNS, connection, and TLS
Distance between the test location and server region, DNS, IPv4 or IPv6, and connection reuse affect results. Test international services from both Japan and the target country.
Origin server
PHP, the database, CPU, memory, disks, neighboring users, and backend processing affect TTFB. Themes and plugins also matter for WordPress.
Caching and CDN
A CDN HIT, page cache, or object cache can make a site appear much faster. Do not combine HIT and MISS or first and repeat visits in one average.
Front end
Large hero images, unnecessary JavaScript and CSS, web fonts, and external tags can worsen LCP, INP, and CLS. A server migration alone will not fix these issues.
Real-user environment
The experience changes with device performance, connection, region, browser, and login state. Use CrUX or your own RUM to inspect slower real-user experiences.
Evidence audit of 18 historical TTFB figures: why they cannot rank providers
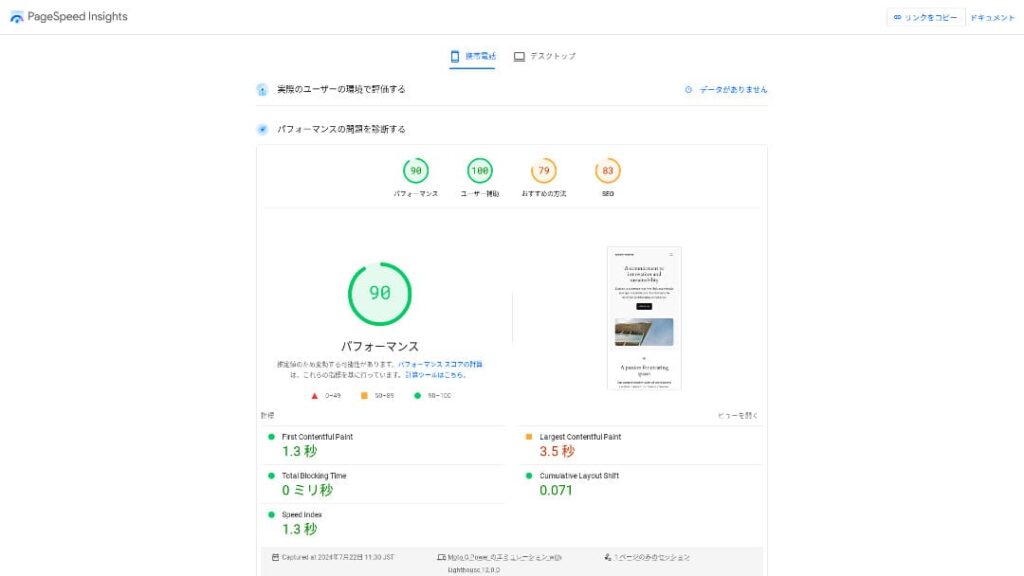
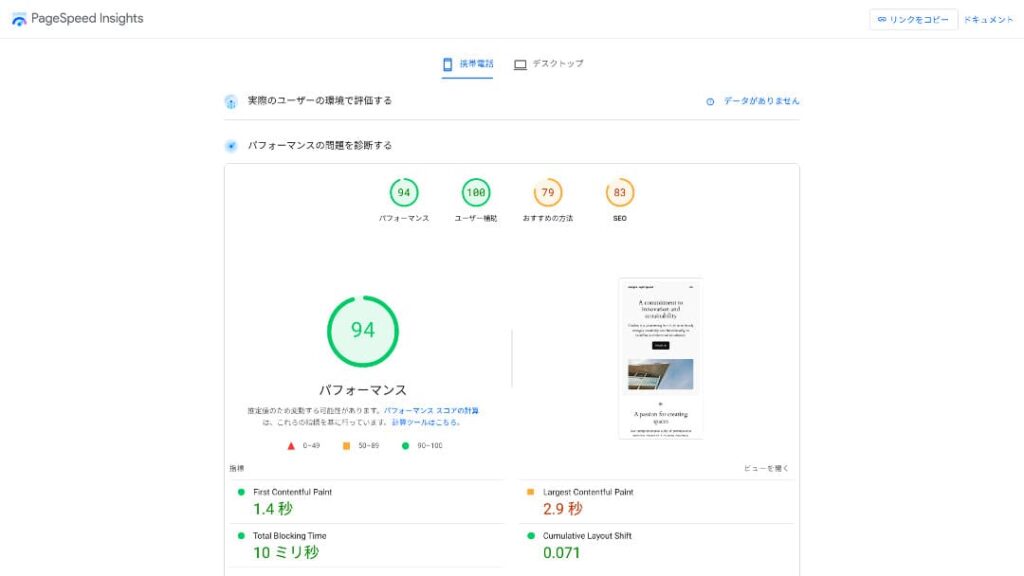
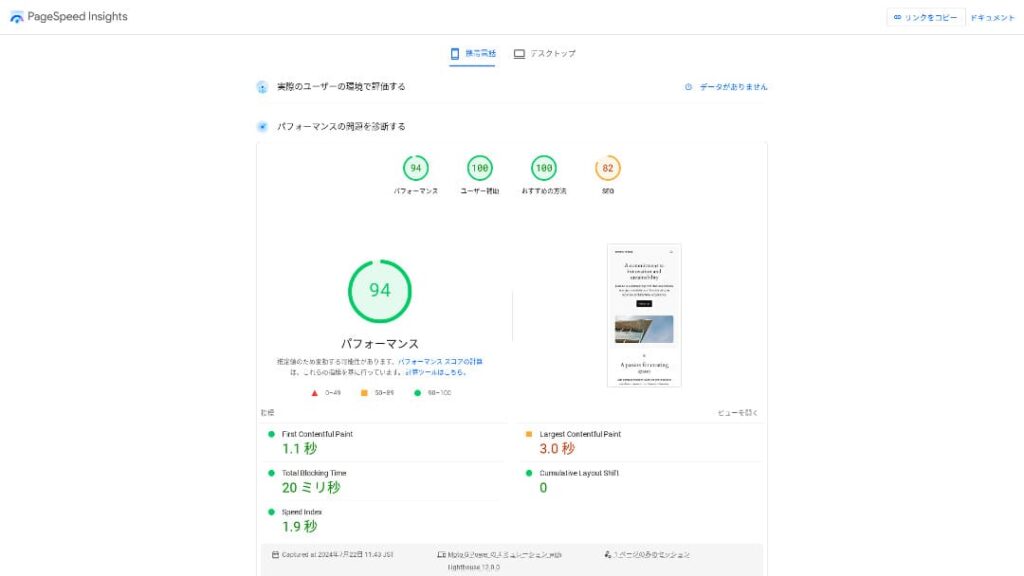
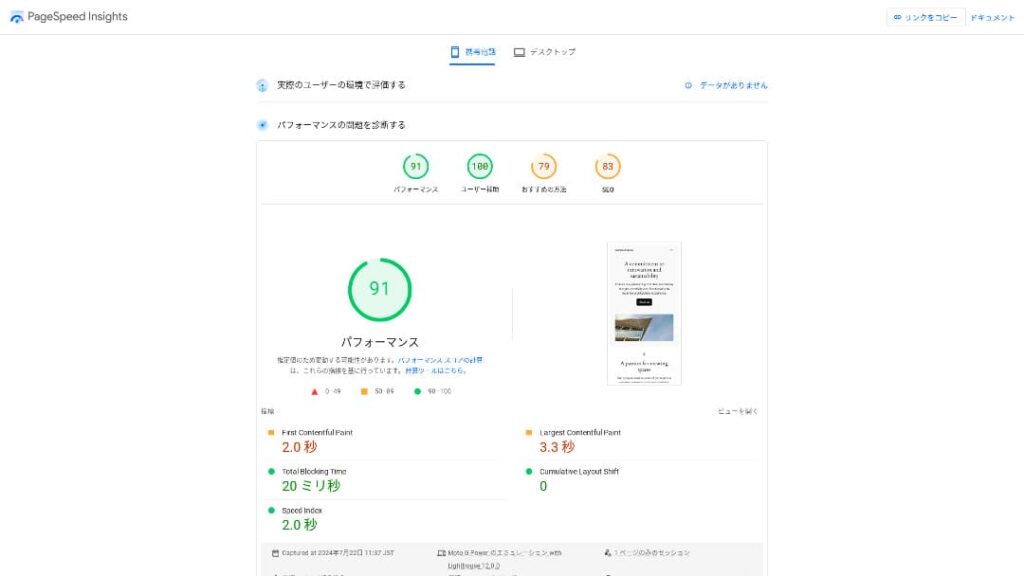
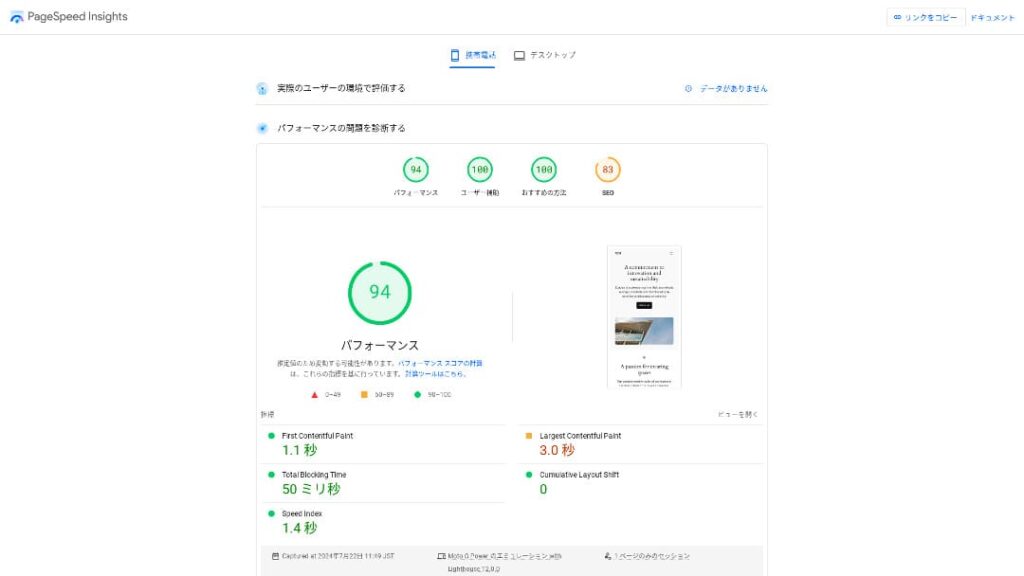
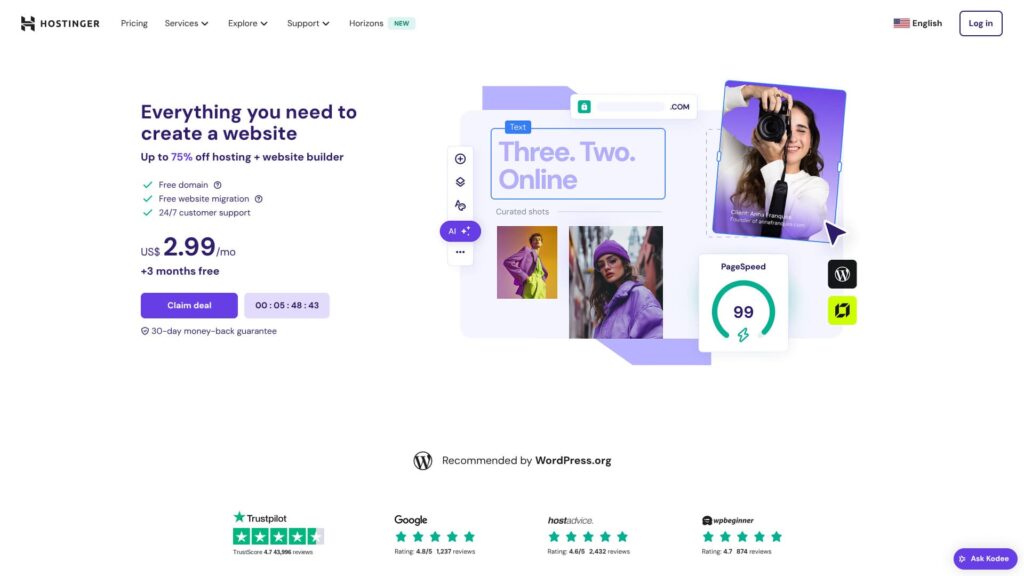
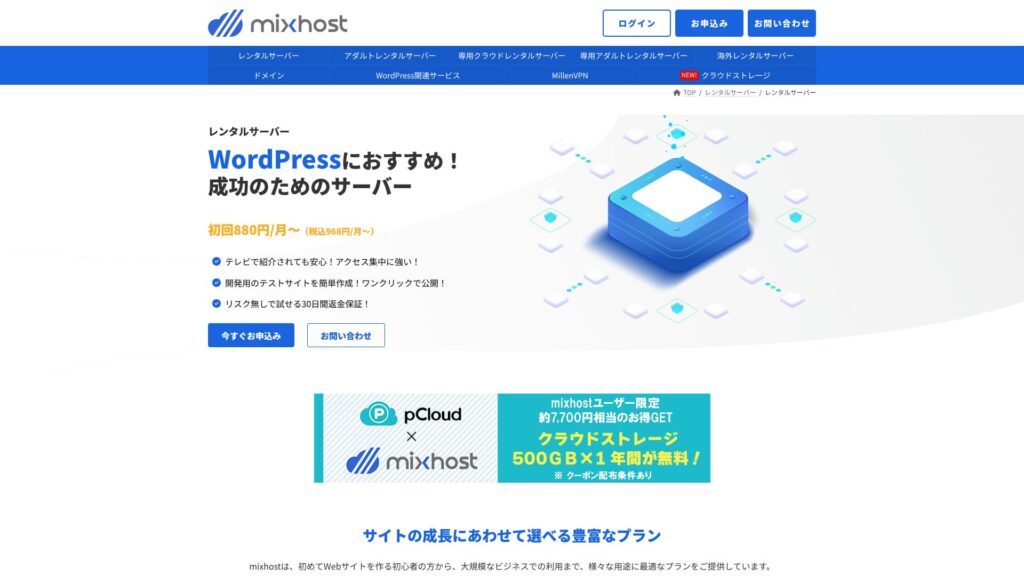
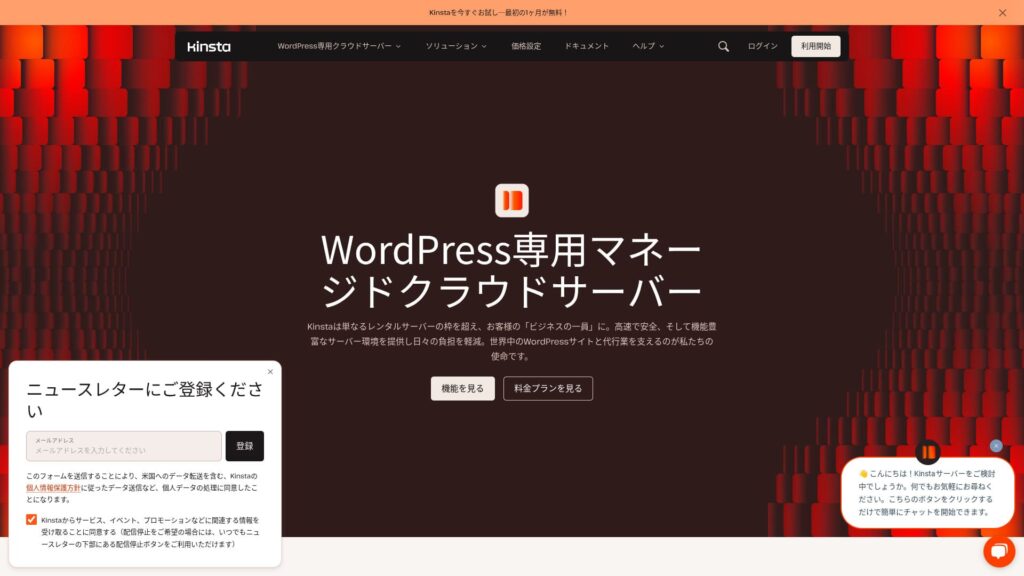
These values appeared in the older article and are retained to make its review history traceable. Common dates, locations, URLs, trial counts, plans, cache conditions, and raw logs are missing, so the values cannot support a 2026 performance ranking or purchasing decision.
A difference between 30 ms and 440 ms does not by itself establish that one provider is about 15 times faster.A CDN-cached static page and a dynamic WordPress page tested from far away are different test subjects.
| Provider | Historical TTFB | Evidence retained | Main missing conditions | Treatment in 2026 |
|---|---|---|---|---|
| Kinsta | 30ms | Official-site screenshot | Date, location, URL, count, and raw logs | Choose Tokyo or Osaka and retest as a managed-hosting candidate |
| Hostinger | 31ms | Official-site screenshot | Data center, test location, count, and raw logs | Choose a region and renewal terms, then retest |
| Xserver Business | 40ms | Saved PSI screenshot | Raw TTFB logs, repeat conditions, and plan | Retest as a business candidate |
| wpX Speed | 40ms | Saved PSI screenshot | Raw TTFB logs, repeat conditions, and plan | Choose a current W1–W7 plan and retest |
| Lolipop! | 80ms | Saved PSI screenshot | Plan, time, count, and cache | Retest the current plan under consideration |
| Star Server | 90ms | Saved PSI screenshot | Plan, time, count, and raw logs | The old service no longer accepts new sign-ups. Test its successor, Star Rental Server, as a separate service. |
| Rakko Server | 120ms | Saved PSI screenshot | Location, cache, count, and raw logs | Retest under current conditions only if the use case fits |
| Xserver | 130ms | Saved PSI screenshot | Location, cache, count, and plan | Retest the same site as a standard Japan-based candidate |
| mixhost | 150ms | Official-site screenshot | Date, location, count, and raw logs | Retest with LiteSpeed Cache states separated |
| ConoHa WING | 160ms | Saved PSI screenshot | Location, cache, count, and plan | New sign-ups suspended; test under matching conditions after resumption |
| ColorfulBox | 190ms | Saved PSI screenshot | Server region, test location, count, and cache | Record the selected region and retest |
| Shin Rental Server | 200ms | Saved PSI screenshot | Plan, time, count, and current infrastructure | Measure the current plan again |
| LittleServer | 200ms | Saved PSI screenshot | Plan, time, count, and site configuration | Retest under matching conditions for a small-site use case |
| CORESERVER | 210ms | Saved PSI screenshot | Location, cache, count, and price tier | Retest a plan in the same price tier |
| DreamHost | 400ms | Saved PSI screenshot | Target country, CDN, count, and plan | Test from the target country for an English-speaking audience or Japan for a Japanese audience |
| Bluehost | 420ms | Saved PSI screenshot | Target country, CDN, count, and plan | Choose the operating language and visitor region, then retest |
| Sakura Rental Server | 440ms | Saved PSI screenshot | Target plan, time, count, and raw logs | Retest the current plan under consideration |
| Namecheap | 440ms | Saved PSI screenshot | Target country, CDN, count, and plan | Retest only if the international use case fits |
Statistics cannot be recalculated from the old values either.We do not know whether each value was one run or an average, whether the cache was cold or warm, or which URL was tested. For future comparisons, retain raw CSV or JSON values, response headers, and measurement times.
View saved test screens and provider images from the old article
Ten test conditions to fix before comparing
Without matching conditions other than provider, you cannot tell whether a difference comes from the server, site, or network. Record these ten items on one test sheet first.
Use the same site copy
Use the same WordPress version, theme, plugins, articles, images and database size.
The same target URL
Keep results separate by URL; do not mix the home page, articles, search and forms.
Comparable price range and plans
Do not put low-cost plans and premium managed plans in the same ranking; match the purpose and budget.
The same PHP and CMS conditions
Standardize the PHP and WordPress versions, database and compression settings as far as possible.
Region and connection
Keep the test location, device, browser and network throttling fixed. For an overseas audience, also test in the target country.
CDN usage
Record no CDN, CDN HIT and CDN MISS as separate conditions; do not mix them in one column.
Cache status
Separate cold and warm tests, as well as page, object and browser caches.
Date, time and peak hours
Record the time zone and repeat tests in the morning, afternoon and evening, and on weekdays and weekends.
The same tool and version
Record each tool's name, version and settings, whether using PSI, Lighthouse, WebPageTest, curl or another tool.
Raw logs for every run
Save all values, headers, errors and reasons for exclusions as CSV or JSON; do not select only the best result.
Six steps for reproducible speed tests
The goal is not simply to collect more measurements. Another person following the same procedure should be able to reach a similar conclusion.
Shortlist two or three providers by purpose and operating requirements
Classify visitor regions, monthly budget, WordPress, email, backups, phone and chat support, and migration assistance as required, preferred or unnecessary.
Create a replica close to the production site
Use the actual images, article volume, plugins and forms rather than a lightweight default theme. Do not copy personal information or production keys.
Separate cold and warm tests
Measure the first request after clearing caches separately from repeat visits with warm caches. Check response headers for CDN HIT or MISS as well.
Test each condition at least five times, preferably ten
Do not use only the first or lowest value. Keep errors and outliers too, and record the reason for any exclusion.
Vary the time of day and compare the median and slower results
Shared hosting is affected by traffic. Test in the morning, afternoon and evening, and check the median, 75th percentile and values near the maximum.
Score display, administration and recovery on one evaluation sheet
Assess LCP, INP and CLS alongside TTFB, administration, backup restoration, support, migration and renewal costs.
Example: repeatedly recording TTFB with curl
The following example records DNS, connection, TLS, TTFB and total times ten times in CSV format. It does not clear caches. For cold tests, use the cache-clearing function of each service separately and save the response headers too.
printf "run,dns,connect,tls,ttfb,total,http_code\n"
for i in $(seq 1 10); do
  curl -sS -o /dev/null \
    -w "$i,%{time_namelookup},%{time_connect},%{time_appconnect},%{time_starttransfer},%{time_total},%{http_code}\n" \
    "https://example.com/target-page/"
done
A difference between curl TTFB and PSI values does not necessarily indicate a problem.Test locations, devices, networks, redirects, caches and each tool's measurement scope differ. Do not average values from different tools in the same column.
Divide the final assessment into three groups
TTFB, LCP, INP, CLS, cache HIT/MISS and image or JavaScript bottlenecks.
WordPress administration, updates, search, forms, payments, deployment and staff task time.
Backup frequency, retention, restore granularity, recovery testing, support response and DNS changes.
How to read PageSpeed Insights
PageSpeed Insights shows field data from real users and lab data from a controlled environment. Their periods and conditions differ, so the numbers often do not match.
Field data aggregates real usage over the past 28 days
CrUX field data is a rolling 28-day aggregation of actual Chrome user experiences. A change made yesterday will not be fully reflected immediately; if there is insufficient URL-level data, only origin-level data may appear.
Lab data makes issues easier to reproduce
Lighthouse lab tests are easier to repeat under the same conditions, making them useful for detecting regressions and investigating causes during development. They simulate one device and connection, however, and do not represent the full variety of real users' regions and devices.
INP requires real interactions; use TBT as a lab aid
INP is measured from real user interactions. An automated Lighthouse run alone cannot measure INP the same way, so use Total Blocking Time as a supplementary lab metric and check INP in CrUX or your own RUM after release.
| Field | Real users over the past 28 days, with varied devices, connections and regions. Suitable for judging the final impact of improvements. |
|---|---|
| Lab | A controlled simulation, run once or repeatedly under current conditions. Useful for investigation and comparison during development. |
| No URL-level data | Combine origin data, Lighthouse, your own RUM and repeated tests on a replica site. |
| How to decide | Fix causes in the lab, then confirm improvements in real use with field data. |
Six conditions to check before choosing on speed alone
A server that displays pages a few dozen milliseconds faster is not a fast choice for a business if you cannot restore it, afford renewals, migrate email or operate it with your team.
Initial and renewal prices
Check not only the monthly equivalent but also the total upfront payment, renewal price, taxes and next year's domain and email costs.
Backup and restoration
Check retention, off-site storage, restore granularity and cost, and whether data can actually be restored, as well as backup frequency.
Support channels
Check phone, chat and email availability, hours, language and technical scope, and decide who will contact support during an incident.
Control panel and permissions
Check the permissions and usability needed for multiple staff, billing, DNS, FTP/SSH, staging and log access.
Email and DNS
The procedure differs depending on whether you move only the website or email too. Plan how to avoid missed email during the DNS transition.
Future growth and exit
Check whether you can change plans, handle traffic spikes, host multiple sites, keep external backups and migrate to another provider.
Signs it may be time to move
Investigate the cause before moving as soon as the site feels slow. If several of the following persist after improvements, it may be worth creating a test environment and comparing alternatives.
- Slow TTFB results persist at multiple times of day and affect LCP even with caching.
- CPU, memory or concurrency limits are frequently reached, with little room for improvement even on a higher plan.
- Uncacheable operations such as WordPress administration, search, forms or payments are slow.
- Traffic spikes cause errors, but resource usage and logs are not available for inspection.
- Backups are hard to restore, retention is insufficient or recovery cannot be tested.
- Support scope, renewal costs or the control panel no longer suit the way your team operates.
If the cause is outside the server, fixing it before migration is safer.If uncompressed images, heavy sliders, advertising tags, unnecessary plugins, JavaScript, fonts or layout shifts are the main cause, the problem will remain after migration.
Official information checked in July 2026
Speed metrics were checked against primary sources from Google and Chrome, and service features against each provider's official pages. Prices and promotions change, so they are not treated as fixed ranking factors here; check the official pages again immediately before signing up.
- web.dev: Core Web Vitals (LCP, INP, CLS and the 75th percentile)
- web.dev: measuring TTFB, the rough 0.8-second guide, and field versus lab data
- Google: field and lab data in PageSpeed Insights
- Chrome for Developers: CrUX tools and rolling 28-day data
- Xserver: current main features
- wpX Speed: a dedicated WordPress environment, NVMe and autoscaling
- Kinsta: data center locations, including Tokyo and Osaka
- Hostinger: current web hosting plans and features
- ConoHa WING: confirmation that new registrations are temporarily suspended
- mixhost: LiteSpeed Cache, backups and current service information
- Star Server: closure to new registrations and information on its successor, Star Rental Server
Web hosting speed comparison FAQ
Which web host is the fastest overall?
No single provider can be declared fastest for every site. Visitor regions, pages, plans, caches, and traffic differ, so shortlist two or three by use case and test the same site copy under matching conditions.
Does a high PageSpeed Insights score mean the server is fast?
Not necessarily. The score reflects the whole page, including images, JavaScript, CSS, and fonts. Compare TTFB while separately assessing real-user LCP, INP, and CLS.
What TTFB in seconds is considered good?
web.dev gives 0.8 seconds or less as a rough goal for many sites. TTFB is not itself a Core Web Vital. Do not pass a service on the minimum alone; examine slower results around the 75th percentile and their effect on LCP.
How many speed tests should I run?
For a shortlist, test each condition at least five times; around ten is recommended in practice. Separate cold and warm runs, vary the time of day, and compare the median and slower results.
Can I compare a site without CrUX data?
Yes. For a new or small site with insufficient field data, combine lab testing such as Lighthouse with your own RUM or repeated measurements of the same site copy. Check field data again once it has accumulated after launch.
Will changing hosts always improve Core Web Vitals?
No. If heavy images, JavaScript, advertising tags, fonts, or layout shifts are the main cause, moving hosts alone may help only a little. Examine the TTFB and LCP breakdowns and identify the bottleneck first.
Should I migrate immediately if my site feels slow?
First check caching, plugins, images, PHP, the database, and external tags. If delays persist at multiple times of day and resource shortages or recovery and operational limits are confirmed, compare migration candidates in a site copy.
Final decision: choose using the median for your own replica site, not an old ranking
The old TTFB values for 18 providers can be kept as historical records, but cannot be used as a 2026 ranking. Shortlist at most three providers by purpose and repeatedly test the same replica site under the same region, connection and cache conditions. Comparing the median and slower results rather than the minimum TTFB, along with LCP, INP, CLS, administration, restoration and renewal costs, helps avoid being misled by numbers.
- Shortlist two or three providers by visitor region, budget, CMS and support.
- Test the same replica site and URL under comparable plan, region and cache conditions.
- Test each condition at least five times, preferably ten, and save all raw values.
- Fix causes in the lab and confirm improvements at the 75th percentile of real usage.
- Include operational and recovery speed as well as page speed in the final assessment.